
Maths
>
GCSE
>
Rates of Change
>
How do you...
How do you find the rate of change?
3 years ago
·
215 Replies
·
20618 views
Vickie Shanahan
215 Answers
The rate of change refers to how much something for example distance is changing in a specific unit of time. In order to work out the rate of change, you must divide the thing that is changing with how much it has changed in such a unit of time.
Derivatives are the best tool, but not for everyone... Considering two variables (distance and time, for example), you can also take the first and last value of both in a certain process, subtract the ones from the same variable (e.g. last and first distances of the bus from your position) and divide the subtractions of different variables. By doing this with position/distance and time, the rate of change you get is the speed of the object you're analyzing!
First calculate the change , i.e. B-A, where A is the original figure, and B is the figure after the change. The divide the change by A and multiply by 100->((B-A)/A)*100=X%
Friendly and relaxed physics and maths tutoring tailored to your needs
2 reviews
The rate of change in the most simple terms is the "change in something" divided by "the time it took to change". In GCSE maths this often comes up with speed and time graphs. If they ask you to find the rate of change at a certain time from a graph you first draw a tangent to the graph at that point then work out the gradient of that tangent. The gradient on a speed(velocity) - time graph is the rate of chenge of speed(velocity).
I'm available for 1:1 private online tuition!
Click here to view my profile and arrange a free introduction.Uni lecturer, Accredited teacher, Maths, Science. Levels KS1 to Uni
16 reviews
The rate of change can be found by calculating the ratio between the difference in the values (final value minus initial value) of a property divided by the time taken for the change to take place.
I'm available for 1:1 private online tuition!
Click here to view my profile and arrange a free introduction.Distance traveled divided by time it takes. On a graph that would be calculating the difference in the change in y and the change in x
University of Leeds Graduate student ready to teach all that is Maths!
The rate of change measures how a quantity changes over time or across space. It's often represented as the slope of a line connecting two points on a graph.
I'm available for 1:1 private online tuition!
Click here to view my profile and arrange a free introduction.Divide the change of one variable with the change of the other variable
Linear functions have a constant rate of change which is represented as the gradient of the graph.
It is simply the change of y-values with respect to x-values i.e. (y1-y2) / (x1-x2) where (x1,y1), (x2,y2) are the coordinates
the change in y-values by the change in x-values.
To find the rate of change, you must divide the change in y by the change in x (if using a graph, where y is the vertical axis and x is the horizontal axis).
Hello Mrs Vickie Shanahan. There isn't much context to your question here, so I'll keep my response as general as possible:
The rate of change describes a relationship between a dependent and an independent variable. For example, the rate of change of velocity with time or the rate of change of temperature with distance.
In a simple mathematical case, we'd write this as the change in the dependent variable (temperature, dT) over a fixed interval of the independent variable (distance, dx)
Which is mathematically written as dT/dx, or as shown in the graph, dy/dx.
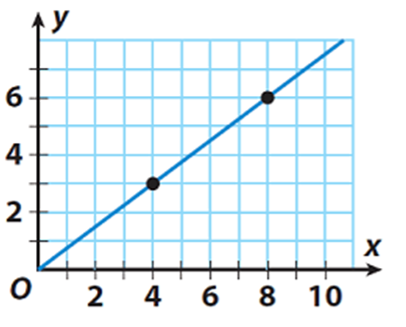
It is then clear that for the linear relationship in the above graph, the rate of change is dy/dx = (y1-y2)/(x2-x1) = (6-3)/(8-4).
There are a couple of ways to find this. If your data is displayed in graph format, you can find the rate of change by dividing the change in y-values by the change in x-values. If you are talking about the instantaneous rate of change (this is called the derivative of a function) then we need to look further at the function itself.
The rate of change measures how one quantity changes relative to another. In mathematics, it is often calculated using derivatives in calculus or the difference between two points in algebra. Here are the common methods to find the rate of change:
1. Average Rate of Change (Algebraic Approach)
The average rate of change between two points on a function is calculated as the slope of the line connecting the points. This is given by:
2. Instantaneous Rate of Change (Using Derivatives)
The instantaneous rate of change of a function at a specific point is the value of the derivative at that point.

This gives the slope of the tangent line to the curve at x=ax = ax=a, representing how the function changes at that exact point.

Think you can help?

Need a GCSE Maths tutor?
Get started with a free online introductions with an experienced and qualified online tutor on Sherpa.
Find a GCSE Maths Tutor